
Managing the Exploit Database is one of those ongoing tasks that ends up taking a significant amount of time and often, we don’t take the time to step back and look at the trends as they occur over time. Have there been more exploits over the years? Perhaps fewer? Is there a shift in platforms being targeted? Has the bar for exploits indeed been raised with the increase in more secure operating system protections?
Recently, one of our users reached out to us and showed us a great dashboard he created with Tableau using the publicly available CSV file we publish in our Exploit Database GitHub repository. We really liked this idea a lot and decided to run with it and see what kind of questions we could ask and answer with the available data. What makes these dashboards particularly useful is that they are not simply static displays; you can interact with them like the one below.
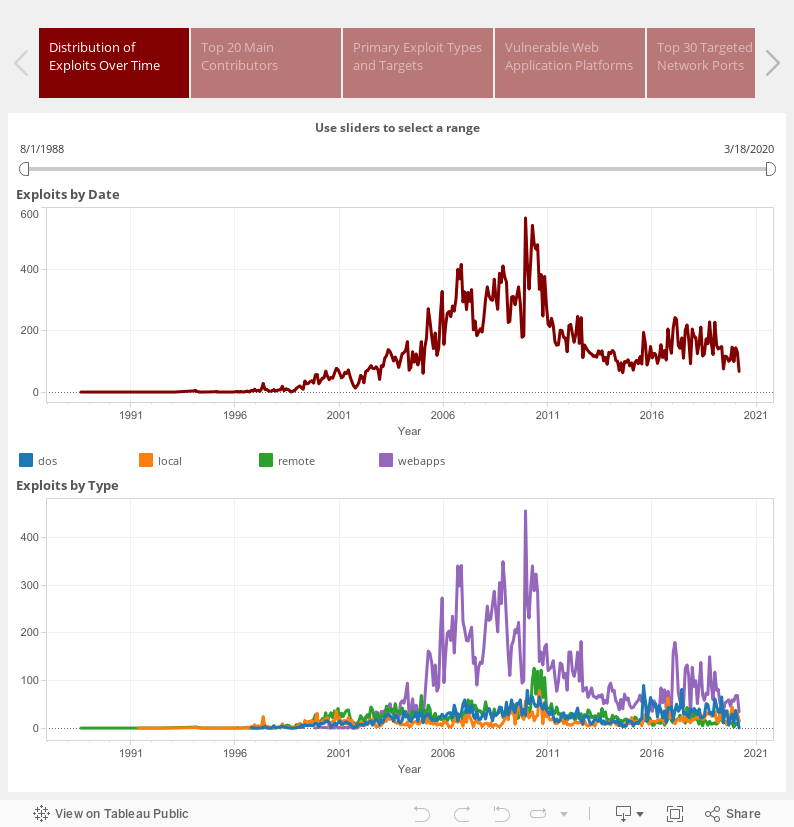
We find these glimpses into our data fascinating and we hope you will, too. A new statistics page has been created over at the Exploit Database that we will update on a monthly basis at minimum so please feel free to check it out regularly, interact with the dashboard, and join us in seeing how the world of exploitation changes over time.