
Author: Matteo Memelli
A few months ago, we decided to make a new module for our Advanced Windows Exploitation class. After evaluating a few options we chose to work with an Adobe Flash 1day vulnerability originally discovered by the Google Project Zero team. Since we did not have any previous experience with Flash internals, we expected a pretty steep learning curve.
We started by trying to debug the Flash plugin on Firefox while running the proof-of-concept (PoC) file and quickly realized that debugging the player can be rather time consuming without appropriate tools due to multiple reasons. First of all, the FlashPlayerPlugin.exe process is spawned by Firefox through the help of an auxiliary process named plugin-container.exe. The latter facilitates communication between the Flash plugin process and the Firefox browser process. Additionally, if protected mode is enabled (default behavior), the FlashPlayerPlugin.exe acts as a broker process and loads a second instance of the player in a sandboxed environment. This sandboxed instance is responsible for parsing and rendering of Flash content.
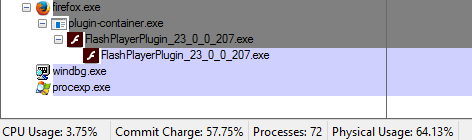
Firefox loading the Flash player through the plugin container.
Most of the functions responsible for rendering of Flash content, including the code exploited in our PoC, are wrapped in the NPSWF32_X_X_X_X dynamic library (DLL), which is loaded by FlashPlayerPlugin.exe. As a result, to successfully debug our process, we need to explicitly inform the debugger that we want it to debug processes spawned by Firefox. Furthermore, in order to set breakpoints on NPSWF32 functions, we need to intercept the second instance of the FlashPlayerPlugin is loaded (sandboxed process), which is the one that loads our target DLL.
All of these preliminary tasks could easily be automated directly from WinDgb. However, since we realized that we would need to automate other functionality as well, we decided to start writing a pykd script that would facilitate debugging the Flash player on Firefox in a less painful way.
One of the problems you encounter when working with the Flash player is the ability to dynamically analyze the ActionScript client code by setting appropriate breakpoints.
The ActionScript 3 architecture runs on the ActionScript Virtual Machine 2 (AVM2) engine and computation in the AVM2 is based on executing the code of a “method body”. As explained in Haifei Li paper “Inside AVM”, a method can be identified from its MethodInfo class as:
- Native – a function in the Flash .text section
- “Normal” – our own code in the AS3 source converted to native code through the Just-In-Time (JIT) compiler
- Static init – executed in interpreter mode.
Since there are no symbols exported for native functions and AS3 client code is dynamically translated into processor-specific instructions at runtime, tracing the execution flow can be quite challenging.
We decided to take an approach similar to the one exposed in “Discover Flash Player Zero-day Attacks In The Wild From Big Data”, where we hook specific functions in the NPSWF32 library to be able to resolve native and jitted methods. Specifically we hook BaseExecMgr::setJit and BaseExecMgr::setNative which we dynamically identify in NPSWF32 by comparing their opcode signatures with the ones found in the compiled avmplus code.
{
// Mark method as been JIT compiled.
m->_isInterpImpl = 0;
m->_isJitImpl = 1;
m->_apply_fastpath = 1;
m->_implGPR = p;
m->_invoker = InvokerCompiler::canCompileInvoker(m)
? jitInvokerNext
: invokeGeneric;
}
void BaseExecMgr::setNative(MethodInfo* m, GprMethodProc p)
{
m->_implGPR = p;
if (isJitEnabled() && InvokerCompiler::canCompileInvoker(m))
m->_invoker = jitInvokerNext;
else
m->_invoker = invokeGeneric;
}
Each time these functions are called, our hooks are executed and the assembly code passes the pointer to the MethodInfo class as an argument followed by the invocation of the MethodInfo::getMethodName function. This pointer is passed to setJit and setNative functions as a parameter in the normal execution flow, which is what allows our hooks to resolve the function names (refer to ESI and EDI registers in the next Figure).
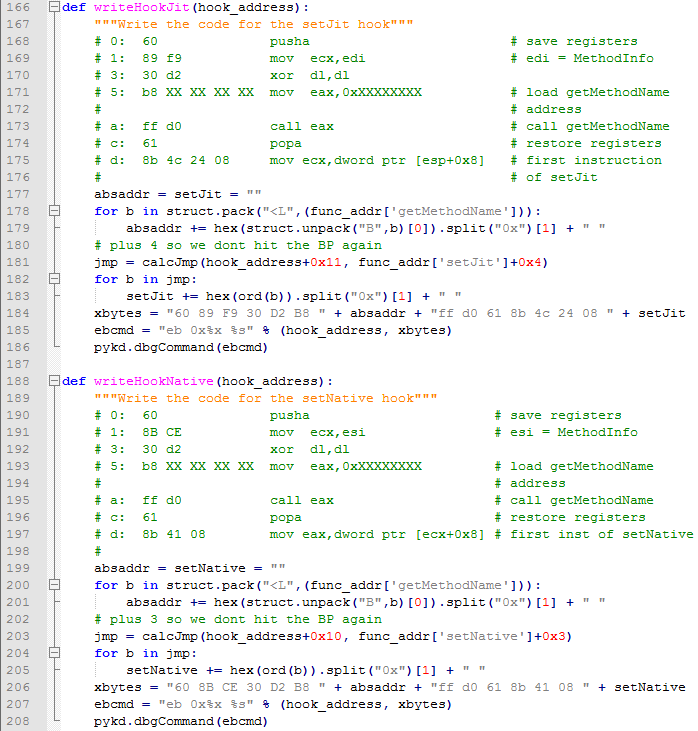
Setting up the hooks to resolve native and jitted functions
As the name suggests getMethodName, returns the name of the method being invoked. Additionally, the address of the method body code can be extracted from the GprMethodProc parameter passed to setJit and setNative.
By putting a breakpoint and an appropriate handler just after the call to getMethodName in our hooks, the pykd script is able to extract the method name as well as its address at runtime. This allows us to trace arbitrary function calls in AS3 code as well as set additional breakpoints to monitor the execution flow.
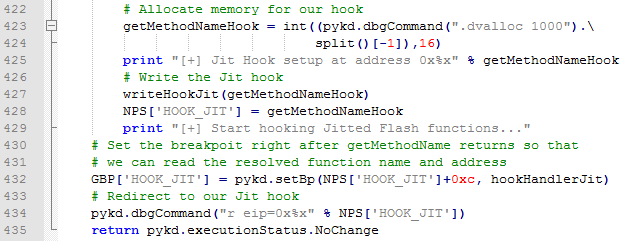
Setting a breakpoint just after the getMethodName call in our hooks
The next sample code and output of our script show these ideas in action. The script lists executed jitted and native methods, as well as sets a breakpoint on the ByteArray writeByte method:
package
{
import flash.display.Sprite;
import flash.utils.ByteArray;
public class ByteArrayTest extends Sprite
{
public function ByteArrayTest():void
{
var bb:ByteArray = null;
var allocate:Array = new Array();
for (var i:int = 0; i < 255; i++) {
bb = new ByteArray();
bb.writeByte(0x57);
bb.writeByte(0x30);
bb.writeByte(0x30);
bb.writeByte(0x54);
allocate.push(bb);
}
}
}
}
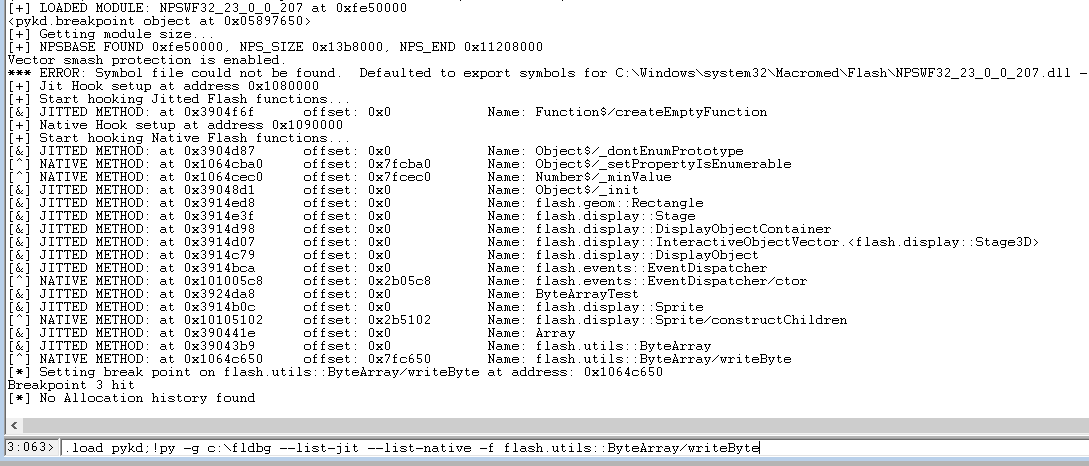
.load pykd;!py -g c:fldbg –list-jit –list-native -f flash.utils::ByteArray/writeByte
With our script easing some of the Flash debugging pains, we kept playing with the 1day PoC and managing to gain a better understanding of the vulnerability. As a consequence, we reached a point where we needed to control heap allocations in order to achieve code execution. However, we first needed to somehow monitor Flash memory allocations before we could work on controlling them.
We went back to studying the available papers on the internet regarding the topic and found out that Flash Player implements a custom heap allocator based on MMgc for both garbage collection and general-purpose memory management. MMgc is a memory management library that has been created as part of the AVM2 and Tamarin projects. The library contains a page allocator called GCHeap, which allocates large blocks of memory from the system and hands out 4KBytes pages to the unmanaged memory allocator (FixedMalloc) and the managed memory allocator (GC).
In order to even attempt implementing an allocation monitor in our script, we needed more information. Specifically, we needed to identify which functions to monitor within the NPSWF32 library. To complicate matters even more, Adobe has recently introduced different heap hardening layers to raise the bar for the exploitation of memory corruption bugs as well as UAF ones.
We looked for further resources on the internet and learned that:
- FixedMalloc can allocate high risk objects on the system heap and separate them from objects allocated in standard GCHeap memory. This increases heap metadata protection and adds randomization to the memory layout.[Project Zero 2015]
- GC allocation and non-GC allocations can be isolated in different GCHeap heaps. [Yuki Chen 2016]
- Objects allocated from the same allocator (FixedMalloc or GC) can be isolated by using different GCHeap heaps (for example FixedMalloc data and FixedMalloc objects are separated)[Yuki Chen 2016]
Since we needed more details regarding the allocations mechanics to implement a basic heap monitoring system in our script, we continued reverse engineering the NPSWF32 module while comparing our results with the avmplus source.
Based on that effort, we confirmed that FixedMalloc can allocate memory through the GCHeap or the system heap. In the former case, FixedMalloc uses size classes to serve allocations, with each size class handled by a dedicated FixedAllocSafe instance.

MMgc::FixedMalloc::kSizeClasses
The latter is a fast, thread-safe, fixed-size memory allocator for manually freed objects and performs allocations and deallocations through a free list. Depending on the size of the request (bigger or smaller than 0x7f0) either an appropriate FixedAllocSafe allocator is selected or FixedMalloc::LargeAlloc is invoked.
if (size <= (size_t)kLargestAlloc) return FindAllocatorForSize(size)->Alloc(size, flags);
else
return LargeAlloc(size, flags);
REALLY_INLINE FixedAllocSafe* FixedMalloc::FindAllocatorForSize(size_t size)
{
//m_allocs is the FixedMalloc array of FixedAllocSafe objects, each one serving a specific size class
return &m_allocs[index];
[…]
void *FixedMalloc::LargeAlloc(size_t size, FixedMallocOpts flags)
{
[…]
void *item = m_heap->GetPartition(m_largeAllocHeapPartition)->Alloc(blocksNeeded, gcheap_flags);
If a FixedAllocSafe instance cannot satisfy an allocation request (all the allocator memory blocks have been occupied by previous allocations), it asks for more memory by calling FixedAlloc::CreateChunk which returns a pointer to a FixedBlock structure.
{
// Allocate a new block
m_numBlocks++;
vmpi_spin_lock_t *lock = NULL;
if(m_isFixedAllocSafe) {
lock = &((FixedAllocSafe*)this)->m_spinlock;
VMPI_lockRelease(lock);
}
//GCHeap::Partition::Alloc retrieves the Partition object by using the partition index stored in the FixedAlloc instance
FixedBlock* b = (FixedBlock*) m_heap->GetPartition(m_heapPartition)->Alloc(1, GCHeap::kExpand | (canFail ? GCHeap::kCanFail : 0))
The memory blocks returned by FixedAlloc::CreateChunk are basically 4KB memory pages with a 32byte header (refer to the FixedBlock structure below).
{
void* firstFree; // First object on the block's free list
void* nextItem; // First object free at the end of the block
FixedBlock* next; // Next block on the list of blocks (m_firstBlock list in the allocator)
FixedBlock* prev; // Previous block on the list of blocks
uint16_t numAlloc; // Number of items allocated from the block
uint16_t size; // Size of objects in the block
FixedBlock *nextFree; // Next block on the list of blocks with free items (m_firstFree list in the allocator)
FixedBlock *prevFree; // Previous block on the list of blocks with free items
FixedAlloc *alloc; // The allocator that owns this block
char items[1]; // Memory for objects starts here
};
Number of items per memory block.
FixedAlloc::CreateChunk requests are served by GCHeap::Partition::Alloc which retrieves the appropriate Partition object by using the partition index stored in the FixedAllocSafe instance (refer to m_heapPartition in the previous figure).
Large Allocations (>0x7f0) on the other hand, are handled by FixedMalloc::LargeAlloc which eventually also calls into GCHeap::Partition::Alloc requesting for a specific number of memory blocks. Therefore, in the most recent versions of Flash (we believe versions > 20.0.0.235), GCHeap requests are served through partition objects (GCHeap::Partition::Alloc) which means that allocations and deallocations always take place within a specific partition. Hence, memory blocks provided by the GCHeap are now isolated in heap regions belonging to a specific partition object. After we had a better idea on how GCHeap isolation is achieved in Flash, we went back to see which functions we could breakpoint at to monitor unmanaged memory allocations. We initially thought we could just set a breakpoint on the FixedAlloc::Alloc allocator method, however, since this function is declared as an “inline” function for performance reasons (as we believe), the resulting Flash plugin DLL contains multiple instances of the same assembly code.
{
void *item;
{
MMGC_LOCK(m_spinlock);
item = FixedAlloc::InlineAllocSansHook(size, flags);
GCAssertMsg(item != NULL || (flags&kCanFail), "NULL is only valid when kCanFail is set");
}
}
REALLY_INLINE void* FixedAlloc::InlineAllocSansHook(size_t size, FixedMallocOpts opts)
{
(void)size;
GCAssertMsg(m_heap->IsStackEntered() || (opts&kCanFail) != 0, "MMGC_ENTER must be on the stack");
GCAssertMsg(((size_t)m_itemSize >= size), "allocator itemsize too small");
// Obtain a non-full block if there isn't one.
if(!m_firstFree) {
bool canFail = (opts & kCanFail) != 0;
CreateChunk(canFail);
if(!m_firstFree) {
if (!canFail) {
GCAssertMsg(0, "Memory allocation failed to abort properly");
GCHeap::SignalInconsistentHeapState("Failed to abort");
/*NOTREACHED*/
}
return NULL;
}
}
FixedBlock* b = m_firstFree;
GCAssert(b && !IsFull(b));
b->numAlloc++;
// Take the object from the free list if it is not empty
void *item = NULL;
if (b->firstFree) {
item = FLPop(b->firstFree);
// Assert that the freelist hasn't been tampered with (by writing to the first 4 bytes).
GCAssert(b->firstFree == NULL ||
(b->firstFree >= b->items &&
(((uintptr_t)b->firstFree - (uintptr_t)b->items) % b->size) == 0 &&
(uintptr_t) b->firstFree < ((uintptr_t)b & GCHeap::kBlockMask) + GCHeap::kBlockSize)); #ifdef MMGC_MEMORY_INFO // Check for writes on deleted memory. VerifyFreeBlockIntegrity(item, b->size);
#endif
}
else {
// Otherwise take the object from the end of the block.
item = b->nextItem;
GCAssert(item != 0);
if(!IsFull(b)) // There are more items at the end of the block
b->nextItem = (void *) ((uintptr_t)item+m_itemSize);
else
b->nextItem = 0;
}
// If the block has no more free items, be sure to remove it from the list of
// blocks with free items.
if (IsFull(b)) {
// Crash fast in case of heap corruption, aka safe unlinking.
if ( ((b->prevFree && (b->prevFree->nextFree!=b))) ||
((b->nextFree && (b->nextFree->prevFree!=b))) )
VMPI_abort();
m_firstFree = b->nextFree;
b->nextFree = NULL;
GCAssert(b->prevFree == NULL);
if (m_firstFree)
m_firstFree->prevFree = 0;
}
item = GetUserPointer(item);
#ifdef GCDEBUG
// Fresh memory poisoning.
if ((opts & kZero) == 0 && !RUNNING_ON_VALGRIND)
memset(item, uint8_t(GCHeap::FXFreshPoison), b->size - DebugSize());
#endif
// Note that we'd like to use the requested size and not
// b->size but clients will use the slop after calling Size().
// Using the requested size and expanding to b->size via
// VALGRIND_MEMPOOL_CHANGE in Size() doesn't work because the
// scanner scans the full size (see bug 594756).
VALGRIND_MEMPOOL_ALLOC(b, item, b->size);
if((opts & kZero) != 0)
memset(item, 0, b->size - DebugSize());
#ifdef MMGC_MEMORY_PROFILER
if(m_heap->HooksEnabled())
m_totalAskSize += size;
#endif
return item;
}
In an attempt to account for all of those instances, we decided to dynamically search for all the functions that have an opcode sequence similar to “cmp reg32, 0x7F0”. This signature seems to be unique enough to identify instances of the FixedMalloc::Alloc.
It is important to note that although this method appears to be working fine, we are not sure it covers all FixedMalloc cases. It is possible that there exists a better way to achieve the same goal and we are currently exploring other options. However, even though not elegant, our current implementation appears to be sufficient.
For Large allocations on the other hand, the task seems to be easier as we can simply set a breakpoint on the FixedMalloc::LargeAlloc function.
There’s a bit more to say regarding FixedMalloc though. As we stated before, FixedMalloc can allocate memory through the GCHeap or the system heap. In fact, when the GCHeap (GCHeap::GCHeap) is created at the application start, four FixedMalloc objects are initialized (please note that some previous versions have fewer FixedMalloc objects initialized; for example version 20.0.0.237 has only 3 instances of the FixedMalloc class).
FixedMalloc fixedMallocs[kNumFixedPartitions]; // in GCHeap.h
// In GCHeap.cpp GCHeap::GCheap
for (int i=0; i < kNumFixedPartitions; i++) {
fixedMallocs[i].InitInstance(this, i);
}
fixedMallocs = (struct_MMgc::FixedMalloc *)(MMgc::GCHeap + 0x1AF0);
do
{
MMgc::FixedMalloc::InitInstance(fixedMallocs, MMgc::GCHeap, i++);
++fixedMallocs;
}
while ( i < 4 );
Two FixedMalloc instances use the usual FixedAllocSafe allocators as described above, but the remaining two use the system heap as can be seen from the following Figures:
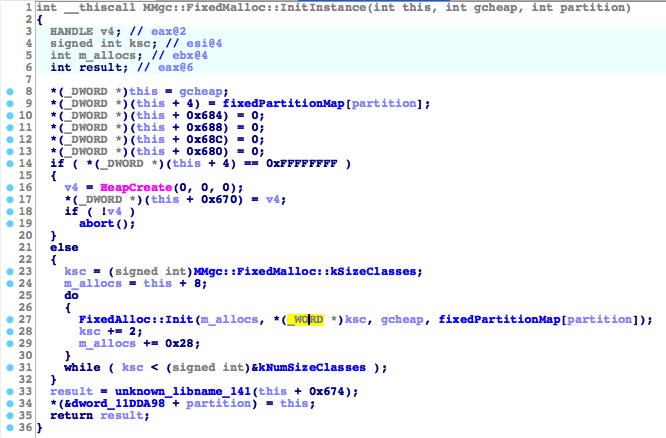
FixedMalloc::InitInstance Flash version 23.0.0.207
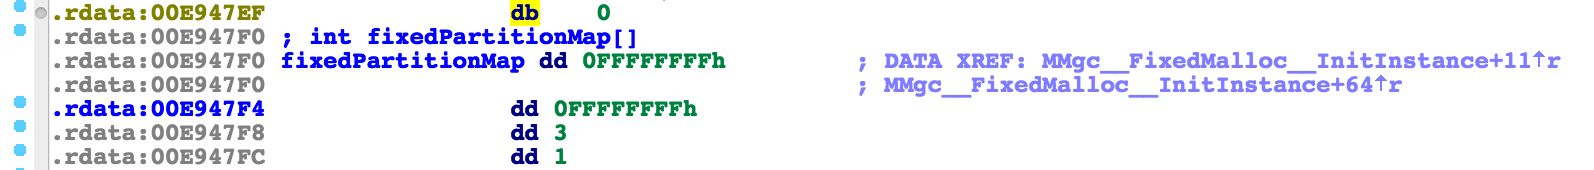
fixedPartitionMap Flash version 23.0.0.207. Two FixedMalloc instances use the GCHeap (partition 1,3), the remaining two FixedMalloc use the system heap (0xffffffff)
Therefore, when using FixedMalloc, objects can be isolated by either performing allocations through GCHeap partitions or by allocating them on separate system heaps. Since we want to monitor the allocations and their separation, we can check from which FixedMalloc instance the allocation was performed (Each FixedMalloc uses a different GCHeap partition). This is done by analyzing the FixedBlock header at the beginning of the page where the allocation is located, and extracting the pointer of the relative FixedAllocSafe allocator (the FixedBlock alloc field at offset +0x1C from the beginning of the memory page). Since we know the allocation size, we can gather the relative kSizeClassIndex index from that pointer (kSizeClassIndex[] is an array that lets FixedMalloc determine the allocator to use for a given size) and walk to the beginning of the m_allocs array (the FixedMalloc array of FixedAllocSafe allocators).
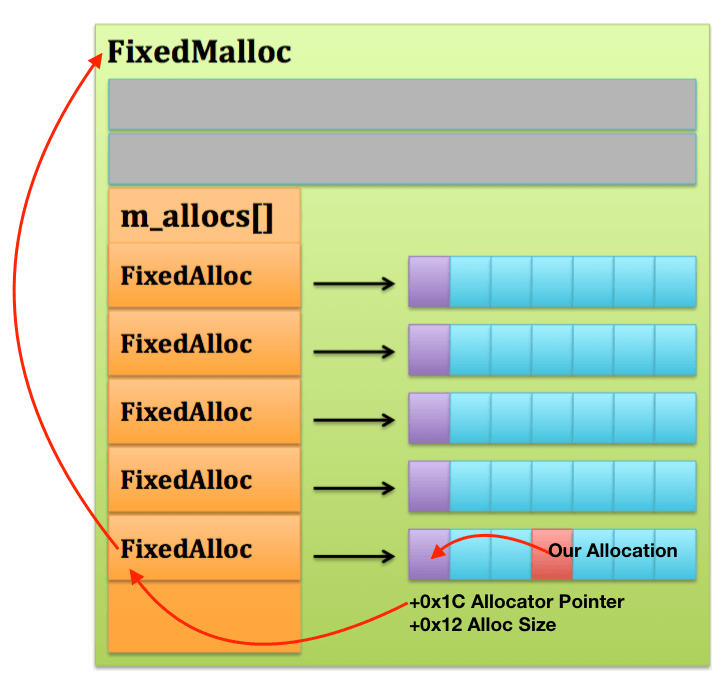
Grabbing the FixedMalloc instance address
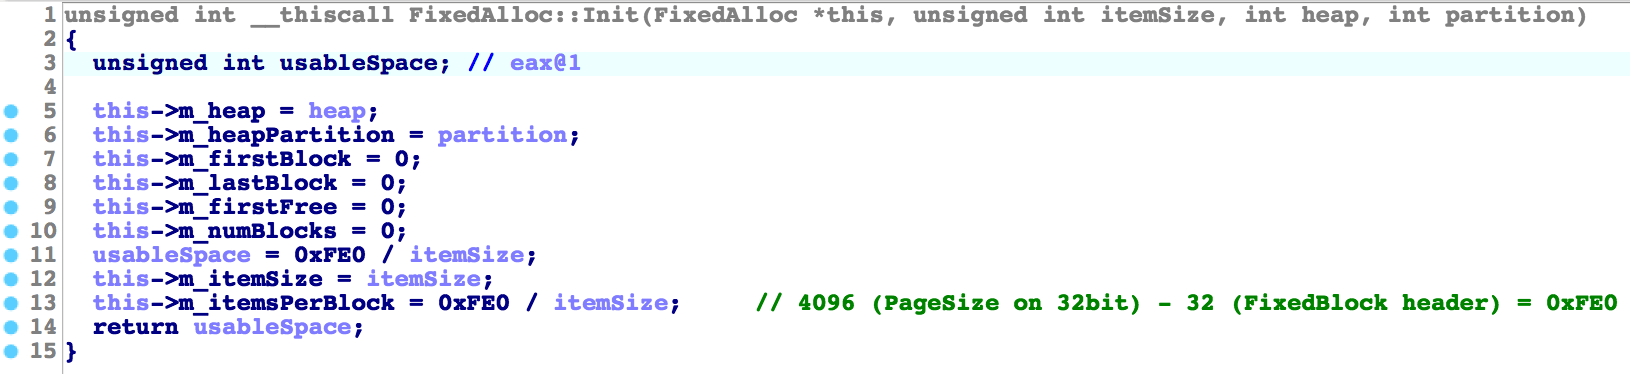
Alternatively, we can retrieve the partition index from the FixedAlloc instance by accessing the m_heapPartition field at offset +0x4:
void __thiscall MMgc::FixedAlloc::Init(MMgc::FixedAlloc *this, unsigned int itemSize, MMgc::GCHeap *heap, int heapPartition)
{
this->m_heap = heap;
this->m_heapPartition = heapPartition;
this->m_firstBlock = 0;
this->m_lastBlock = 0;
this->m_firstFree = 0;
this->m_numBlocks = 0;
this->m_itemSize = itemSize;
this->m_itemsPerBlock = 0xFE0 / itemSize;
}
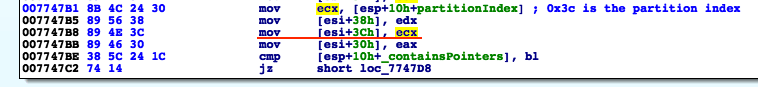
For large allocations, we identify the FixedMalloc instance by simply extracting the ECX (this) value when we break on FixedMalloc::LargeAlloc.
FixedMalloc system heap allocations on the other hand, are performed through HeapAlloc calls, from which we can simply extract the hHeap parameter to monitor the heap separation:
_In_ HANDLE hHeap,
_In_ DWORD dwFlags,
_In_ SIZE_T dwBytes
);
For managed memory, the single GC object instance creates all GCAlloc allocators upfront. From the GC constructor we can see the allocators are also created with heap separation in mind, since a partition index is passed to the GCAlloc constructor.
for (int i=0; i<kNumSizeClasses; i++) {
for (int j=0; j<kNumGCPartitions; j++) {
containsPointersNonfinalizedAllocs[i][j] = mmfx_new(GCAlloc(this, kSizeClasses[i], true, false, false, i, j, SmallGCAllocHeapPartition(j), 0));
containsPointersFinalizedAllocs[i][j] = mmfx_new(GCAlloc(this, kSizeClasses[i], true, false, true, i, j, SmallGCAllocHeapPartition(j), 0));
containsPointersRCAllocs[i][j] = mmfx_new(GCAlloc(this, kSizeClasses[i], true, true, true, i, j, SmallGCAllocHeapPartition(j), 0));
noPointersNonfinalizedAllocs[i][j] = mmfx_new(GCAlloc(this, kSizeClasses[i], false, false, false, i, j, SmallGCAllocHeapPartition(j), 0));
noPointersFinalizedAllocs[i][j] = mmfx_new(GCAlloc(this, kSizeClasses[i], false, false, true, i, j, SmallGCAllocHeapPartition(j), 0));
}
}
As we were working on the NPSWF32 disassembly, we noticed that a total of 4 GC partitions (kNumGCPartitions=4) are used for managed memory.
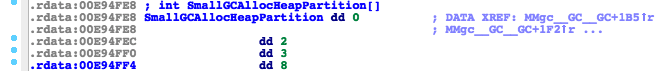
SmallGCAllocHeapPartition array, Flash version 23.0.0.207.
i = 0;
v7 = this + 0x8BC;
do
{
j = 0;
v32 = v7;
do
{
ptr = (int)new(0x50u);
if ( ptr )
v10 = GCAlloc::GCAlloc(ptr, this, MMgc::GC::kSizeClasses[i], 1, 0, 0, i, j, SmallGCAllocHeapPartition[j], 0);
else
v10 = 0;
*(_DWORD *)(v32 - 0x280) = v10;
v11 = (int)new(0x50u);
if ( v11 )
v12 = GCAlloc::GCAlloc(v11, this, MMgc::GC::kSizeClasses[i], 1, 0, 1, i, j, SmallGCAllocHeapPartition[j], 0);
else
v12 = 0;
*(_DWORD *)v32 = v12;
v13 = (int)new(0x50u);
if ( v13 )
v14 = GCAlloc::GCAlloc(v13, this, MMgc::GC::kSizeClasses[i], 1, 1, 1, i, j, SmallGCAllocHeapPartition[j], 0);
else
v14 = 0;
*(_DWORD *)(v32 + 0x280) = v14;
v15 = (int)new(0x50u);
if ( v15 )
v16 = GCAlloc::GCAlloc(v15, this, MMgc::GC::kSizeClasses[i], 0, 0, 0, i, j, SmallGCAllocHeapPartition[j], 0);
else
v16 = 0;
*(_DWORD *)(v32 + 0x500) = v16;
v17 = (int)new(0x50u);
if ( v17 )
v18 = GCAlloc::GCAlloc(v17, this, MMgc::GC::kSizeClasses[i], 0, 0, 1, i, j, SmallGCAllocHeapPartition[j], 0);
else
v18 = 0;
*(_DWORD *)(v32 + 0x780) = v18;
++j;
v19 = v32 + 4;
v32 += 4;
}
while ( j < 4 );
++i;
v7 = v19;
}
while ( i < 40 );
For the GC allocators, the partition index (m_partitionIndex) is stored within the GCAlloc objects at offset +0x3C, and therefore we can recover it while monitoring the GCAlloc::Alloc method.
GCAlloc constructor m_partitionIndex in AVM2
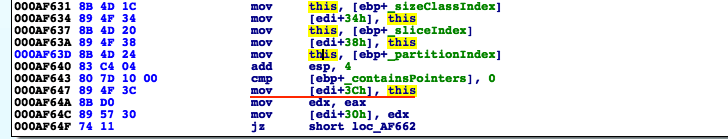
GCAlloc constructor m_partitionIndex in Flash version 23.0.0.207
Having gained a bit more understanding on the topic, we started to implement the allocation monitor functionality in our script by dynamically identifying the allocator functions within the Flash player code, and putting strategic breakpoints at their relative addresses.
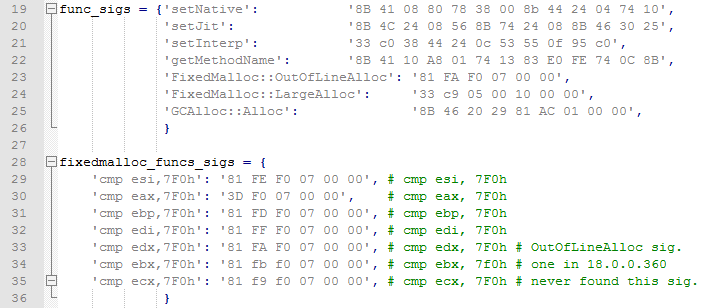
Attempting to identify Flash allocation functions by signature
Following is the output of the script while tracing native and jitted functions and attempting to monitor the memory allocations for the Actionscript code previously used as an example.
Trace native and jitted functions and attempt to monitor FixedMalloc GCHeap and system heap allocations as well as GC allocations. Start monitoring allocations only after ByteArrayTest is being jitted to decrease the output noise and break point at flash.display::LoaderInfo
Looking at these results, we can identify a pattern in our “FOR loop”, where for every single ByteArray instance we see a GC GCHeap allocation of 0x60 bytes, a system heap allocation of 0x28 bytes and a FixedMalloc GCHeap allocation of size 0x1000.
ByteArray objects and data
The 0x60 bytes GC allocation is the ByteArrayObject which stores a pointer to the ByteArray::Buffer object (0x28 bytes) on the system heap. The latter has a pointer to the array of bytes (0x1000 bytes FixedMalloc::LargeAlloc) on the GCHeap.
ByteArray objects and data
If we compare the above output with the one obtained running the same code on an older version of the Flash player (17.0.0.188 July 2015) we can actually see how the new player is separating the allocations by placing the ByteArray::Buffer objects on the system heap. Until recently and along with Vector objects, these have been an ideal target for obtaining read/write primitive by corruption of their metadata. With isolation, exploitation of these object vulnerabilities has become harder.
ByteArray objects and data on Flash 17.0.0.188
By monitoring allocations we were finally able to choose the right object to use for our exploit, and control the execution flow. The actual exploit is outside of scope for this blog post however.
It is imperative to note that this script is far from being a production tool. It has been more of a playground for us to understand Flash internals, which turned out to be a far more painful and frustrating experience than we cared for. We also think that this script is a good example on how debugger extensions can make your life (relatively) easier in complex debugging scenarios. Due to this complexity there is certainly a danger that we have misunderstood certain mechanics of the Flash memory management. Therefore, if any mistakes in coding or logic are identified, please reach out to us so that we can correct them.
Fldbg can be found on GitHub, it requires pykd >= 0.3 and works on Firefox 32bit only for now. We tested Fldbg on Flash versions >= 17.0.0.188 32bit. Please note that, if you are using a Firefox version implementing the new sandbox stack, you will have to attach to the Firefox broker process to be able to use Fldbg.